Markets
$63 Trillion of World Debt in One Visualization
Enjoy this graphic? You can also find it in our new infographic book – now available on Amazon!
$63 Trillion of World Debt in One Visualization
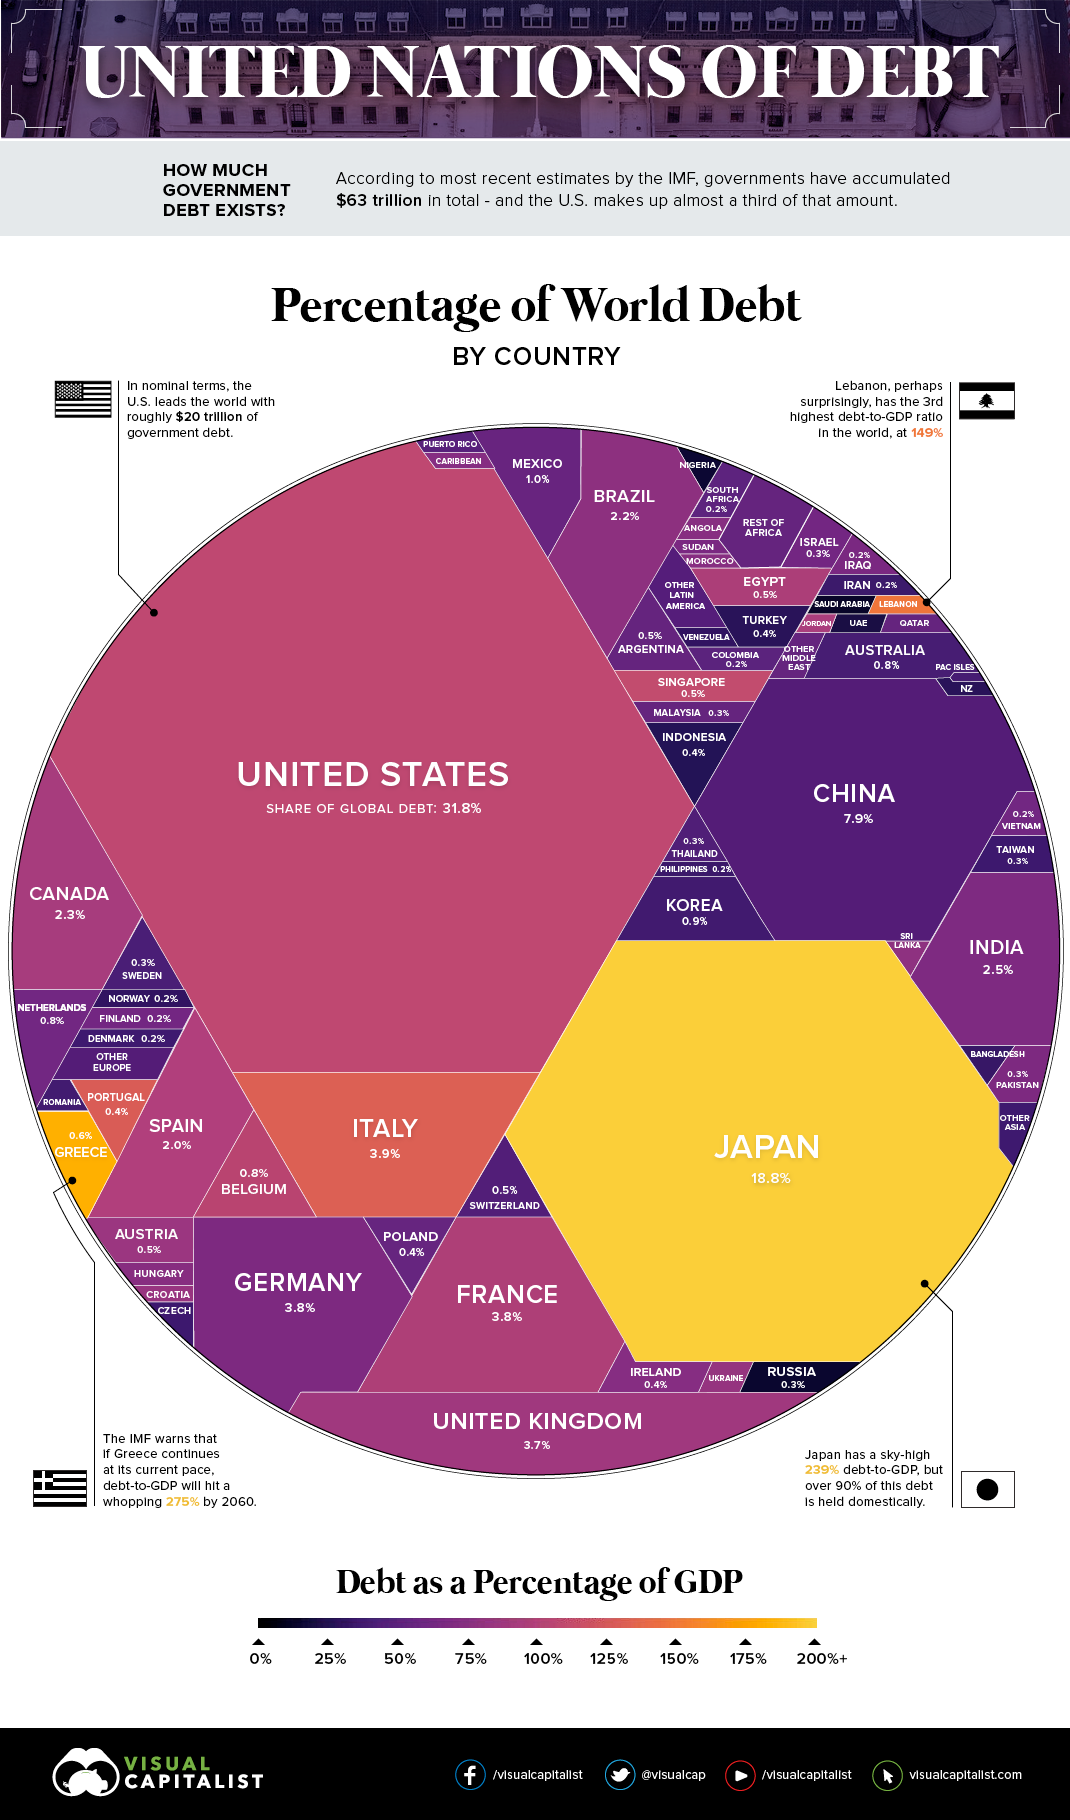
If you add up all the money that national governments have borrowed, it tallies to a hefty $63 trillion.
In an ideal situation, governments are just borrowing this money to cover short-term budget deficits or to finance mission critical projects. However, around the globe, countries have taken to the idea of running constant deficits as the normal course of business, and too much accumulation of debt is not healthy for countries or the global economy as a whole.
The U.S. is a prime example of “debt creep” – the country hasn’t posted an annual budget surplus since 2001, when the federal debt was only $6.9 trillion (54% of GDP). Fast forward to today, and the debt has ballooned to roughly $20 trillion (107% of GDP), which is equal to 31.8% of the world’s sovereign debt nominally.
The World Debt Leaderboard
In today’s infographic, we look at two major measures: (1) Share of global debt as a percentage, and (2) Debt-to-GDP.
Let’s look at the top five “leaders” in each category, starting with share of global debt on a nominal basis:
| Rank | Countries | Debt ($B) | % of Global Debt | Debt-to-GDP |
|---|---|---|---|---|
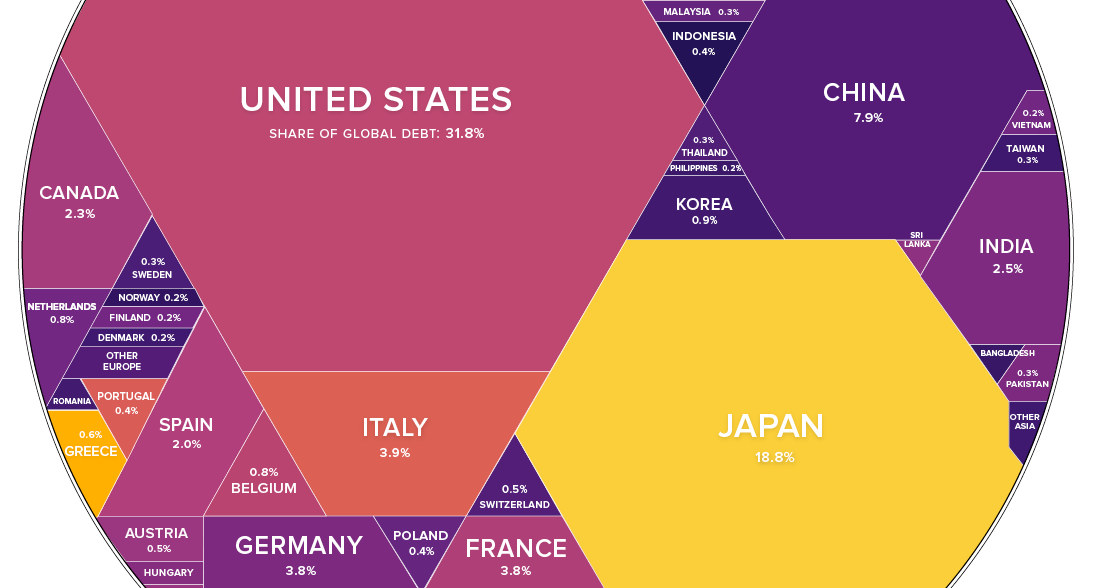
| #1 | United States | $19,947 | 31.8% | 107.1% |
| #2 | Japan | $11,813 | 18.8% | 239.3% |
| #3 | China | $4,976 | 7.9% | 44.3% |
| #4 | Italy | $2,454 | 3.9% | 132.6% |
| #5 | France | $2,375 | 3.8% | 96.3% |
Together, just these five countries together hold 66% of the world’s debt in nominal terms – good for a total of $41.6 trillion.
Next, here’s the top five for Debt-to-GDP:
| Rank | Country | Debt ($B) | % of Global Debt | Debt-to-GDP |
|---|---|---|---|---|
| #1 | Japan | $11,813 | 18.8% | 239.3% |
| #2 | Greece | $353 | 0.6% | 181.6% |
| #3 | Lebanon | $75 | 0.1% | 148.7% |
| #4 | Italy | $2,454 | 3.9% | 132.6% |
| #5 | Portugal | $267 | 0.4% | 130.3% |
While only Italy and Japan here are considered major economies on a global scale, the high debt levels of countries like Greece or Portugal are also important to monitor.
In the IMF’s baseline scenario, Greece’s government debt will reach 275% of its GDP by 2060, when its financing needs will represent 62% of GDP.
A recent IMF report, obtained by Bloomberg
Greece, for example, is continuing along a particularly unsustainable path – and external creditors are getting stingier. Most recently, both the IMF and Greece’s euro-area creditors have demanded for the country to implement a law that automatically introduces austerity measures if a budget surplus of 3.5% of GDP isn’t hit.
While Greece has dismissed such demands as “unacceptable”, the country – along with many others around the globe – will have to accept that constant debt accumulation has eventual consequences.


Markets
U.S. Debt Interest Payments Reach $1 Trillion
U.S. debt interest payments have surged past the $1 trillion dollar mark, amid high interest rates and an ever-expanding debt burden.


U.S. Debt Interest Payments Reach $1 Trillion
This was originally posted on our Voronoi app. Download the app for free on iOS or Android and discover incredible data-driven charts from a variety of trusted sources.
The cost of paying for America’s national debt crossed the $1 trillion dollar mark in 2023, driven by high interest rates and a record $34 trillion mountain of debt.
Over the last decade, U.S. debt interest payments have more than doubled amid vast government spending during the pandemic crisis. As debt payments continue to soar, the Congressional Budget Office (CBO) reported that debt servicing costs surpassed defense spending for the first time ever this year.
This graphic shows the sharp rise in U.S. debt payments, based on data from the Federal Reserve.
A $1 Trillion Interest Bill, and Growing
Below, we show how U.S. debt interest payments have risen at a faster pace than at another time in modern history:
| Date | Interest Payments | U.S. National Debt |
|---|---|---|
| 2023 | $1.0T | $34.0T |
| 2022 | $830B | $31.4T |
| 2021 | $612B | $29.6T |
| 2020 | $518B | $27.7T |
| 2019 | $564B | $23.2T |
| 2018 | $571B | $22.0T |
| 2017 | $493B | $20.5T |
| 2016 | $460B | $20.0T |
| 2015 | $435B | $18.9T |
| 2014 | $442B | $18.1T |
| 2013 | $425B | $17.2T |
| 2012 | $417B | $16.4T |
| 2011 | $433B | $15.2T |
| 2010 | $400B | $14.0T |
| 2009 | $354B | $12.3T |
| 2008 | $380B | $10.7T |
| 2007 | $414B | $9.2T |
| 2006 | $387B | $8.7T |
| 2005 | $355B | $8.2T |
| 2004 | $318B | $7.6T |
| 2003 | $294B | $7.0T |
| 2002 | $298B | $6.4T |
| 2001 | $318B | $5.9T |
| 2000 | $353B | $5.7T |
| 1999 | $353B | $5.8T |
| 1998 | $360B | $5.6T |
| 1997 | $368B | $5.5T |
| 1996 | $362B | $5.3T |
| 1995 | $357B | $5.0T |
| 1994 | $334B | $4.8T |
| 1993 | $311B | $4.5T |
| 1992 | $306B | $4.2T |
| 1991 | $308B | $3.8T |
| 1990 | $298B | $3.4T |
| 1989 | $275B | $3.0T |
| 1988 | $254B | $2.7T |
| 1987 | $240B | $2.4T |
| 1986 | $225B | $2.2T |
| 1985 | $219B | $1.9T |
| 1984 | $205B | $1.7T |
| 1983 | $176B | $1.4T |
| 1982 | $157B | $1.2T |
| 1981 | $142B | $1.0T |
| 1980 | $113B | $930.2B |
| 1979 | $96B | $845.1B |
| 1978 | $84B | $789.2B |
| 1977 | $69B | $718.9B |
| 1976 | $61B | $653.5B |
| 1975 | $55B | $576.6B |
| 1974 | $50B | $492.7B |
| 1973 | $45B | $469.1B |
| 1972 | $39B | $448.5B |
| 1971 | $36B | $424.1B |
| 1970 | $35B | $389.2B |
| 1969 | $30B | $368.2B |
| 1968 | $25B | $358.0B |
| 1967 | $23B | $344.7B |
| 1966 | $21B | $329.3B |
Interest payments represent seasonally adjusted annual rate at the end of Q4.
At current rates, the U.S. national debt is growing by a remarkable $1 trillion about every 100 days, equal to roughly $3.6 trillion per year.
As the national debt has ballooned, debt payments even exceeded Medicaid outlays in 2023—one of the government’s largest expenditures. On average, the U.S. spent more than $2 billion per day on interest costs last year. Going further, the U.S. government is projected to spend a historic $12.4 trillion on interest payments over the next decade, averaging about $37,100 per American.
Exacerbating matters is that the U.S. is running a steep deficit, which stood at $1.1 trillion for the first six months of fiscal 2024. This has accelerated due to the 43% increase in debt servicing costs along with a $31 billion dollar increase in defense spending from a year earlier. Additionally, a $30 billion increase in funding for the Federal Deposit Insurance Corporation in light of the regional banking crisis last year was a major contributor to the deficit increase.
Overall, the CBO forecasts that roughly 75% of the federal deficit’s increase will be due to interest costs by 2034.

-

 Maps2 weeks ago
Mapped: Average Wages Across Europe
-

 Money1 week ago
Which States Have the Highest Minimum Wage in America?
-

 Real Estate1 week ago
Ranked: The Most Valuable Housing Markets in America
-

 Markets1 week ago
Charted: Big Four Market Share by S&P 500 Audits
-

 AI1 week ago
The Stock Performance of U.S. Chipmakers So Far in 2024
-

 Automotive1 week ago
Almost Every EV Stock is Down After Q1 2024
-

 Money2 weeks ago
Where Does One U.S. Tax Dollar Go?
-

 Green2 weeks ago
Ranked: Top Countries by Total Forest Loss Since 2001