Technology
These 6 Charts Show How the World is Improving
View a high resolution version of this graphic
These 6 Charts Show How the World is Improving
View the high resolution version of today’s graphic by clicking here.
It only takes a few minutes of cable news to get the feeling that the world is heading into a tailspin.
Endless images of homicide investigations, natural disasters, car crashes, and drug busts fill the airwaves on a daily basis. It’s upsetting – but also certainly captivating for the average viewer.
In fact, the news cycle thrives on fear and violence, so mainstream networks find a way to fill up 99% of programming with these singular events. It’s addicting and sometimes anger-inducing, but is it representative of what’s really going on in the world?
Good News Happens Slowly
Today’s infographic comes to us from economist Max Roser of Our World in Data, and it highlights six megatrends that show that in many important ways, our world is improving drastically.
The one commonality of these six indicators? They all happen slowly and incrementally, but are more evident with a long-term perspective.
Each family lifted out of poverty, each classroom that gets built, and each village gaining access to basic vaccinations may not seem significant on a scale of billions of people – but over decades, these gains add up to create a richer, more educated, and healthier world and a very powerful statistical story.
Six Global Trends
Here are the six big picture trends pointed out by Roser, using data collected over hundreds of years:
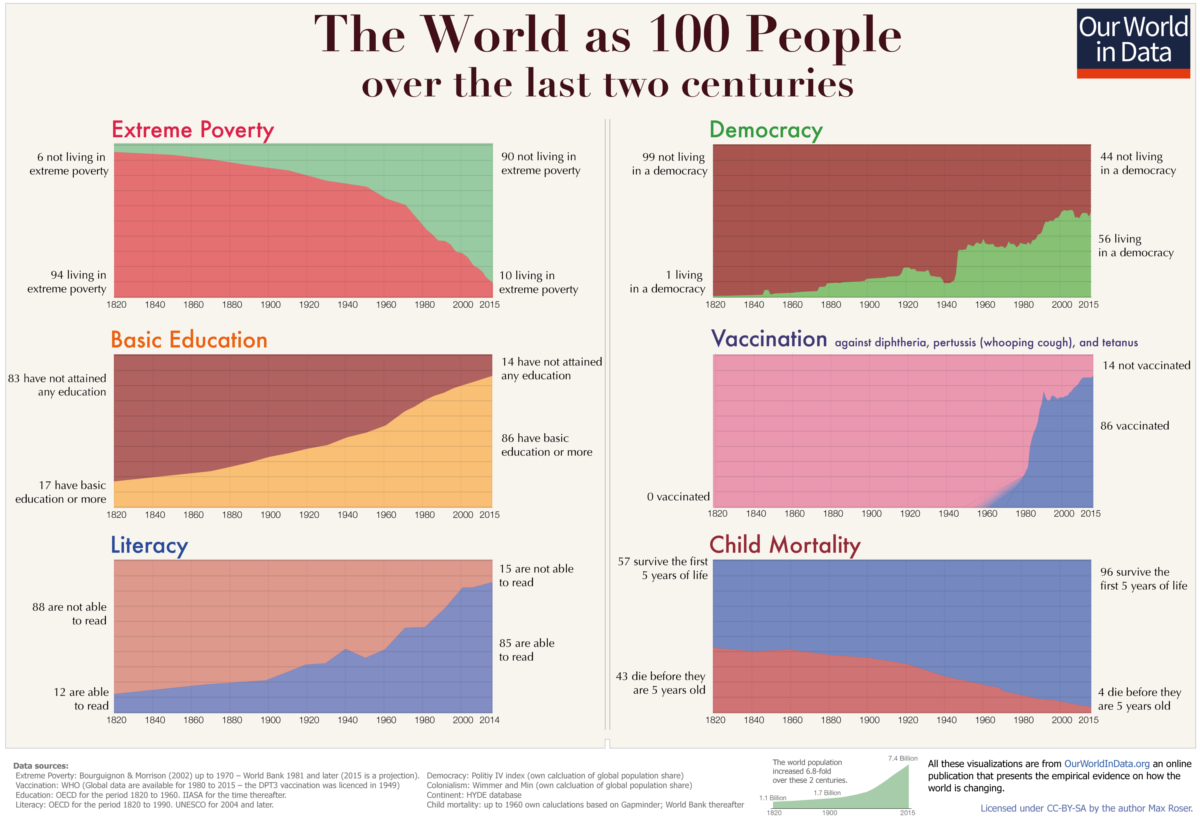
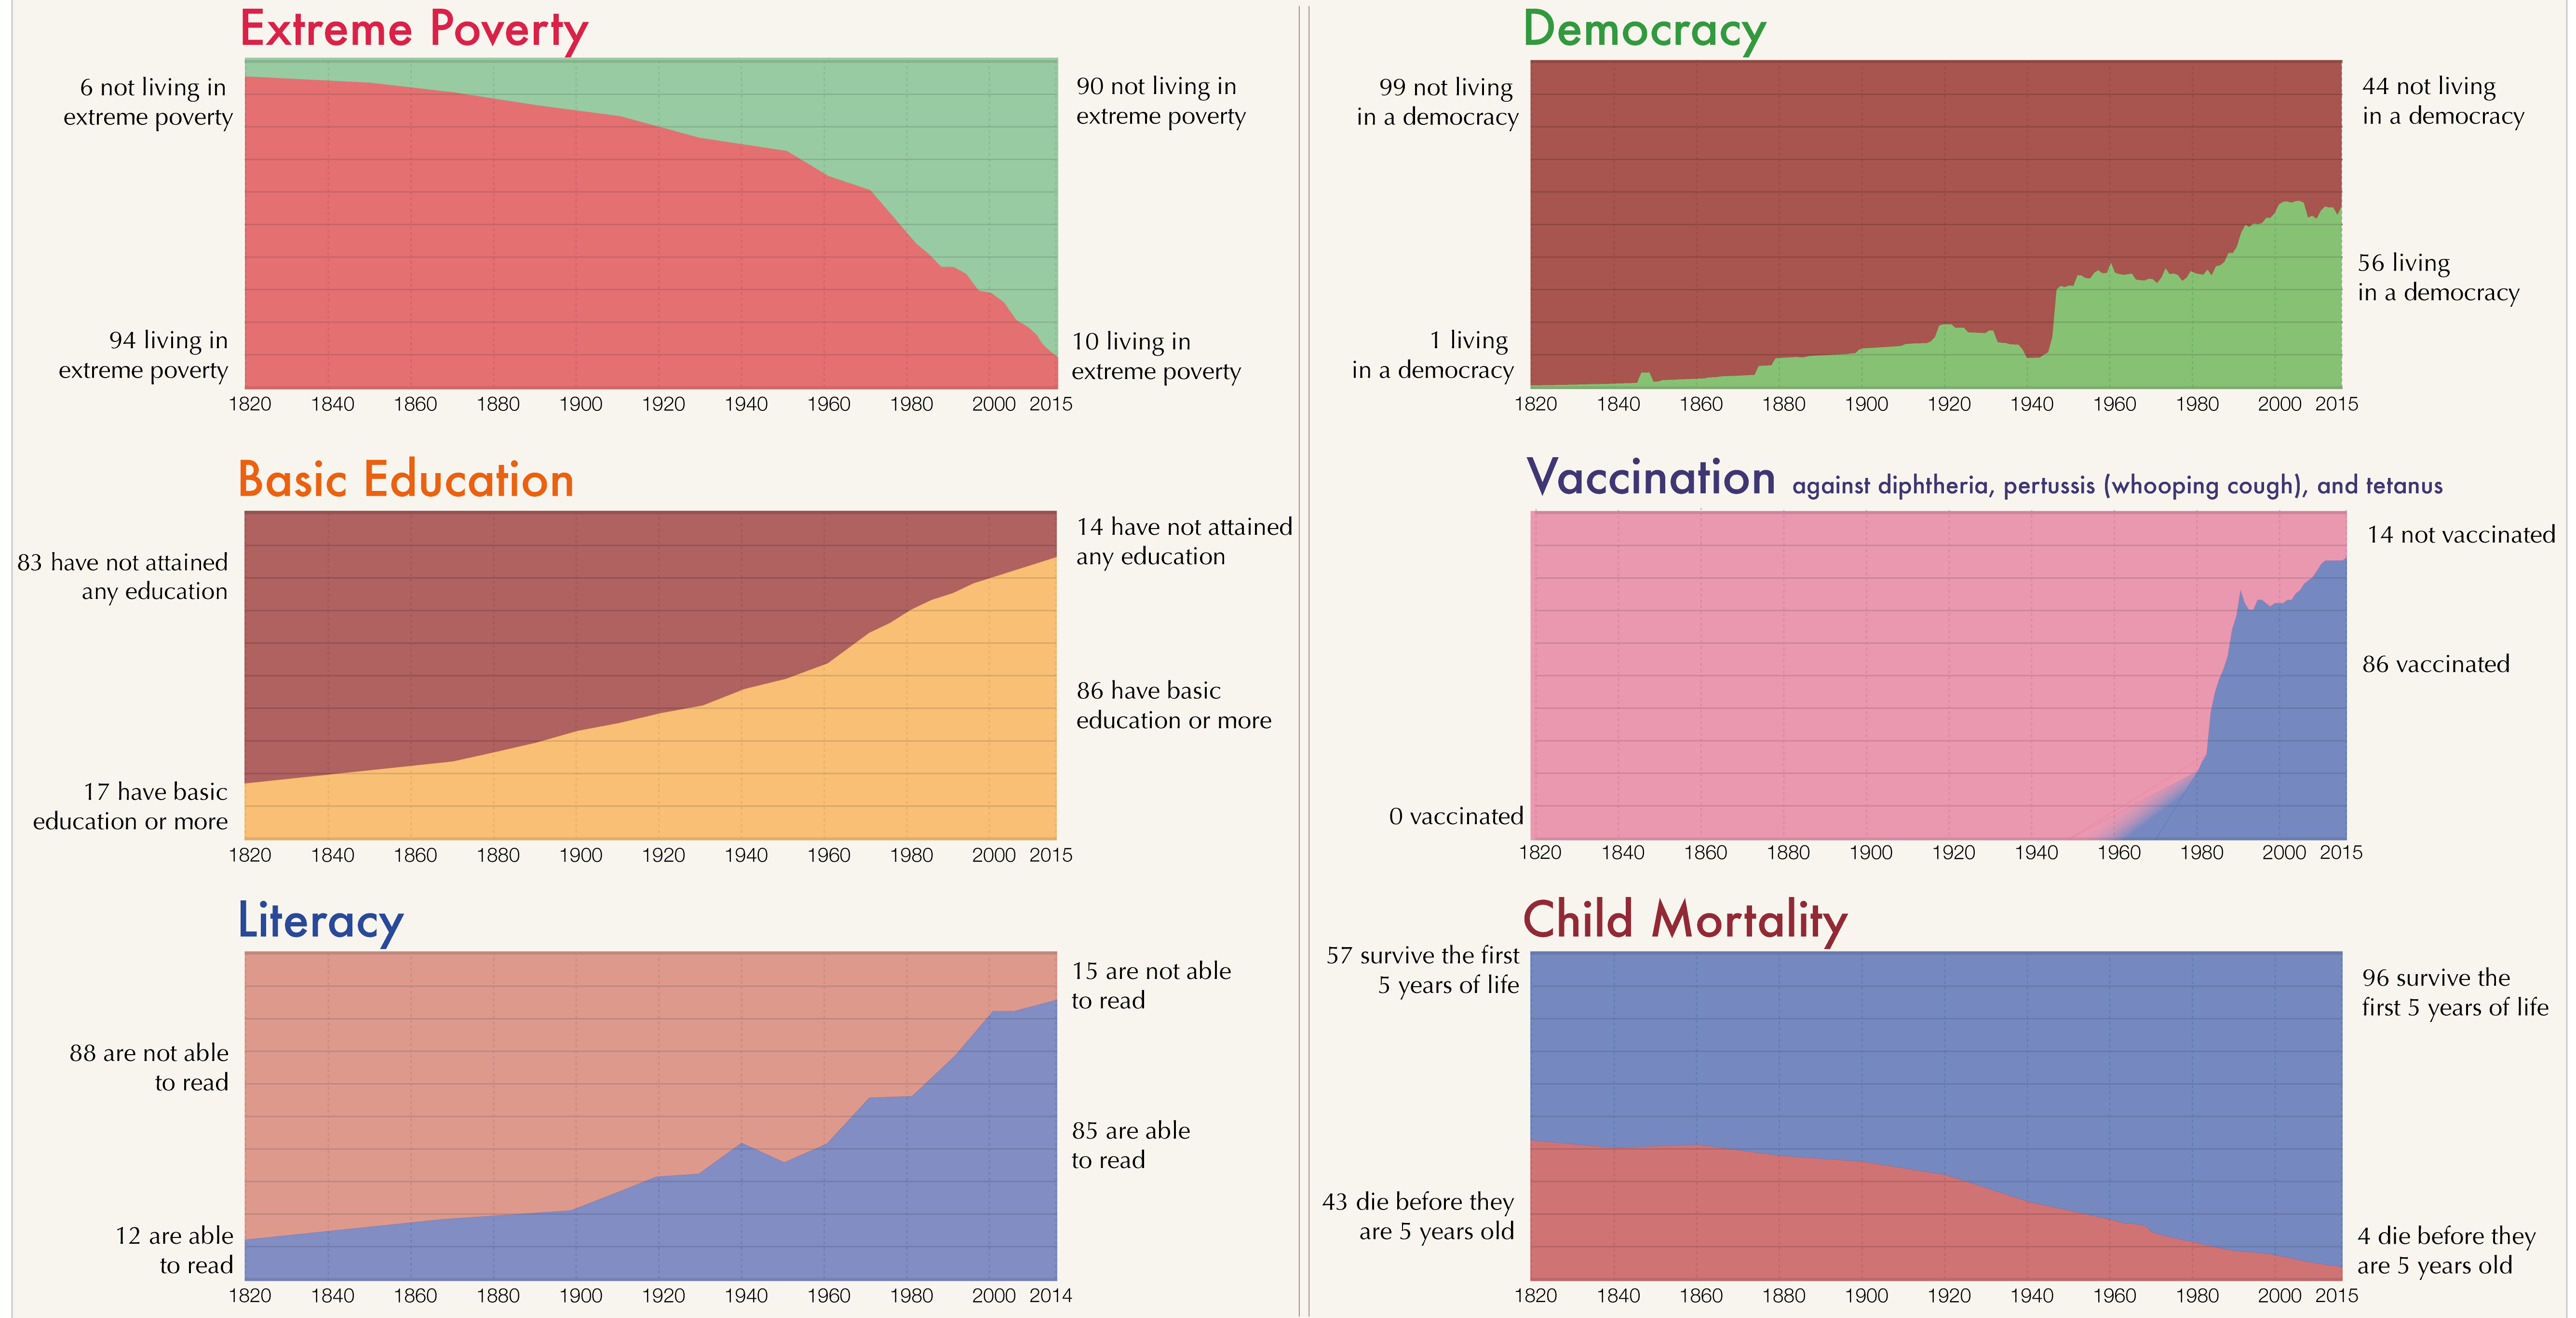
1. Extreme Poverty
The portion of people in extreme poverty – making less than $1.90 per day – has dropped like a rock over the years. Back in 1940, about 75% of the world was in extreme poverty – today, that number is just 10%.
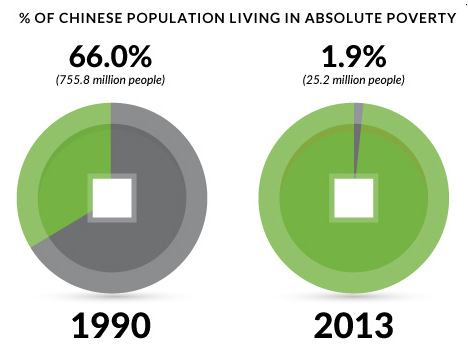
The most potent recent example of this is China, where access to free markets have enabled 700 million people to be lifted out of poverty in just over 20 years.
It’s also worth mentioning that statistics for this category are done using inflation-adjusted international dollars, which take into account inflation over time as well as exchange rates. Non-monetary forms of income are also included in the calculations.
2. Basic Education
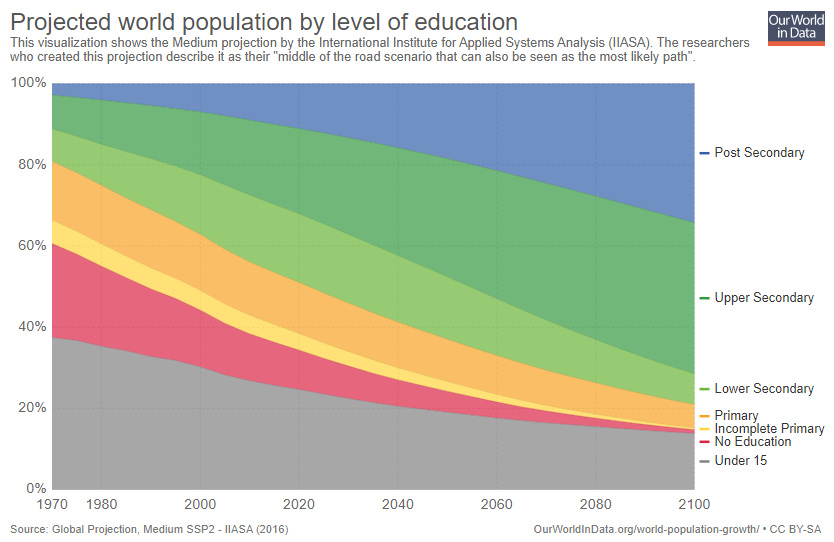
In 1820, only a privileged few were able to get basic schooling. Since then, millions of classrooms and schools have been added around the globe, and the numbers are staggering. In relative terms, we’ve gone from 17% of people having a basic education to 86% today.
Here’s a more detailed breakdown of this, also from Our World in Data:
3. Literacy
Following a similar trend line as basic education, literacy has risen from 12% to 85% over roughly two hundred years. In absolute terms, these numbers are even more impressive. In the 1820s, there were only about 100 million people that could read that were 15 years or older. Today, the number stands at 4.6 billion.
4. Democracy
While the world has been having some short-term setbacks when it comes to freedom and democracy, the overall trend line is still impressive over the long run.
In 1900, only 1 in 100 people worldwide lived in a democracy – and today, the majority (56 in 100) can say they live in a country with free and fair elections.
5. Vaccination
Vaccinations for diseases like whopping cough, tetanus, and diphtheria were unavailable for most of the 200 year chart. However, today around 86% of people globally are vaccinated against these basic and devastating illnesses.
6. Child Mortality
Even as far back as 1920, it used to be that over 30% of infants would die before they hit their 5th birthday.
Since then, developments in housing, sanitation, science, and medicine have made it so that death is a much rarer occurrence for the youngest people in our society. Today, on a global basis, child mortality has been reduced to 4%.


Technology
Visualizing AI Patents by Country
See which countries have been granted the most AI patents each year, from 2012 to 2022.


Visualizing AI Patents by Country
This was originally posted on our Voronoi app. Download the app for free on iOS or Android and discover incredible data-driven charts from a variety of trusted sources.
This infographic shows the number of AI-related patents granted each year from 2010 to 2022 (latest data available). These figures come from the Center for Security and Emerging Technology (CSET), accessed via Stanford University’s 2024 AI Index Report.
From this data, we can see that China first overtook the U.S. in 2013. Since then, the country has seen enormous growth in the number of AI patents granted each year.
| Year | China | EU and UK | U.S. | RoW | Global Total |
|---|---|---|---|---|---|
| 2010 | 307 | 137 | 984 | 571 | 1,999 |
| 2011 | 516 | 129 | 980 | 581 | 2,206 |
| 2012 | 926 | 112 | 950 | 660 | 2,648 |
| 2013 | 1,035 | 91 | 970 | 627 | 2,723 |
| 2014 | 1,278 | 97 | 1,078 | 667 | 3,120 |
| 2015 | 1,721 | 110 | 1,135 | 539 | 3,505 |
| 2016 | 1,621 | 128 | 1,298 | 714 | 3,761 |
| 2017 | 2,428 | 144 | 1,489 | 1,075 | 5,136 |
| 2018 | 4,741 | 155 | 1,674 | 1,574 | 8,144 |
| 2019 | 9,530 | 322 | 3,211 | 2,720 | 15,783 |
| 2020 | 13,071 | 406 | 5,441 | 4,455 | 23,373 |
| 2021 | 21,907 | 623 | 8,219 | 7,519 | 38,268 |
| 2022 | 35,315 | 1,173 | 12,077 | 13,699 | 62,264 |
In 2022, China was granted more patents than every other country combined.
While this suggests that the country is very active in researching the field of artificial intelligence, it doesn’t necessarily mean that China is the farthest in terms of capability.
Key Facts About AI Patents
According to CSET, AI patents relate to mathematical relationships and algorithms, which are considered abstract ideas under patent law. They can also have different meaning, depending on where they are filed.
In the U.S., AI patenting is concentrated amongst large companies including IBM, Microsoft, and Google. On the other hand, AI patenting in China is more distributed across government organizations, universities, and tech firms (e.g. Tencent).
In terms of focus area, China’s patents are typically related to computer vision, a field of AI that enables computers and systems to interpret visual data and inputs. Meanwhile America’s efforts are more evenly distributed across research fields.
Learn More About AI From Visual Capitalist
If you want to see more data visualizations on artificial intelligence, check out this graphic that shows which job departments will be impacted by AI the most.

-

 Mining1 week ago
Gold vs. S&P 500: Which Has Grown More Over Five Years?
-

 Markets2 weeks ago
Ranked: The Most Valuable Housing Markets in America
-

 Money2 weeks ago
Which States Have the Highest Minimum Wage in America?
-

 AI2 weeks ago
Ranked: Semiconductor Companies by Industry Revenue Share
-

 Markets2 weeks ago
Ranked: The World’s Top Flight Routes, by Revenue
-

 Demographics2 weeks ago
Population Projections: The World’s 6 Largest Countries in 2075
-

 Markets2 weeks ago
The Top 10 States by Real GDP Growth in 2023
-

 Demographics2 weeks ago
The Smallest Gender Wage Gaps in OECD Countries