Markets
What Your 401(k) Provider Doesn’t Want You to Know
.container {
max-width: 1070px;
}
.button {
display: inline-block;
height: 45px;
color: #ffffff;
text-align: center;
font-family: helvetica;
letter-spacing: .01rem;
text-decoration: none;
white-space: nowrap;
border-radius: 0px;
line-height: 45px;
border: 1px;
font-size: em(13);
cursor: pointer;
box-sizing: border-box;
background: #464324;
transition-duration: 0.4s;
margin-bottom: 1px;
width: 16.6666%;
}
.button-group {
position: left;
width: 100%;
display: inline-block;
list-style: none;
padding: 0;
margin: 0;
/* IE hacks */
zoom: 1;
*display: inline;
}
.button-group li {
float: left;
padding: 0;
margin: 0;
}
.button-group .button {
display: inline-block;
box-sizing: border-box;
color: white;
}
.button-group > .button:not(:first-child):not(:last-child), .button-group li:not(:first-child):not(:last-child) .button {
border-radius: 0;
}
.button-group > .button:first-child, .button-group li:first-child .button {
margin-left: 0;
border-top-right-radius: 0;
border-bottom-right-radius: 0;
}
.button-group > .button:last-child, .button-group li:last-child > .button {
border-top-left-radius: 0;
border-bottom-left-radius: 0;
border-bottom-right-radius: 0;
}
.button:hover {
background-color: #8E8059;
}
.button.active {
background-color: #8E8059;
}
.button-group :not(:last-child) {
border-right: 1px solid white;
padding-right: 2px;
}
.button-group {
border-right: none;
margin-right: none;
}
@media (max-width: 600px) {
.button {
font-size: 13px;}
}

What Your 401(k) Provider Doesn’t Want You to Know
Born in 1984, the 401(k) plan gave regular Americans a way to make tax-deductible contributions to a retirement account directly from their paychecks.
Today, it’s the single most important investment vehicle for most people in the country:
- 90 million Americans participate in 401(k)s
- $6 trillion in assets are invested in 401(k)s
- 51% of employers match a portion of employee 401(k) contributions
The only problem? With trillions of dollars at stake, financial firms have scrambled to get their hands in as many 401(k) cookie jars as possible.
And today, the vast majority of plans are characterized by huge commissions, expensively managed funds, and layer upon layer of additional – and often hidden – charges.
Flying Below the Radar
Today’s infographic is from Tony Robbins, and it uses data and talking points from his #1 Best Selling book Unshakeable: Your Financial Freedom Playbook, which is now available on paperback.
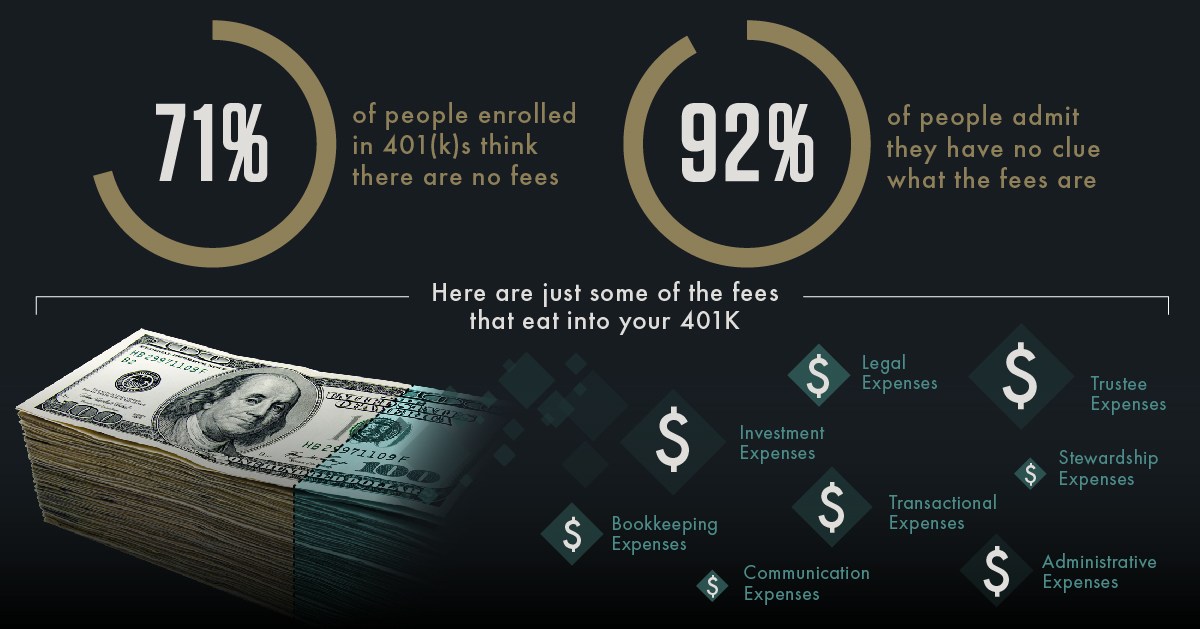
It reveals that although 401(k) plans can be used as crucial vehicles for tax-free retirement saving, 92% of investors admit that they do not have any clue about the fees associated with their plan.
Further, 71% of people enrolled in 401(k)s incorrectly think that there are no fees at all.
The Retirement Savings Drain
Many people are unaware of the types of fees that get loaded onto 401(k) plans – and here are just some of them that get passed to the investor:
- Investment expenses
- Communication expenses
- Bookkeeping expenses
- Administrative expenses
- Trustee expenses
- Legal expenses
- Transactional expenses
- Stewardship expenses
How much does this all end up costing?
According to a thinktank report from Robert Hiltonsmith, the additional 401(k) fees can cut down the size of your retirement nest egg by an average of 30% for an average worker earning $30,000 per year (and saving 5%), this ends up being $154,794 over his or her lifetime.
For someone making $90,000 per year, it works out to a whopping $277,000 in 401(k) fees.
Paying to Play
Hidden fees are bad, but this next practice is potentially even worse.
It turns out that most big-name 401(k) providers accept payments from the mutual funds they offer on their plans, as a part of revenue sharing agreements. In other words, many of the funds you get to choose from are not there based on merit – instead, they were the ones that coughed up the money to be there.
Not surprisingly, these tend to be actively managed, expensive funds – some of which even charge a “front-end load” fee of 3% to even buy into.
Why are there so few options to choose from?
- 93% of 401(k) plans carry under $5 million in total plan assets
- These are the small and medium-sized companies that make up most of the economy
- However, they also have the lowest buying power to demand better options for their employees
As a result, most providers offer limited options to their smaller, less lucrative accounts – and the low fee options that are offered are sometimes marked up big time.
For example, one major insurance company offers an S&P 500 index fund for 1.68% annually when the actual cost is 0.05%. That’s a 3,260% markup!
Small Fees Make a Big Difference
How much do these seemingly tiny percentages really hurt savers? More than you think.
Take two people saving for retirement generating the same return – one is charged 1% in fees, and one is charged 2%.
The 1% difference in fees may not sound like much, but through the power of compound interest, it works out to 10 years of extra retirement money!
What to Do About It?
The problems here are systemic, and not any one company is to be blamed. If you want to take action, here’s what you can do:
Examine: Take a look at your plan’s fee disclosures and the expense ratios of mutual funds you’re invested in. If expense ratios are above 1%, you are likely paying too much.
Compare: Look at available fund options and switch to lower fee options if they offer similar levels of performance.
Lobby: If your 401(k) is getting battered by fees, tell your employer. Employers not only have a fiduciary duty to benchmark their 401(k)s, but also to seek the best option for employees.
The journey towards financial freedom is tough enough as it is – and while a 401(k) is a wonderful tool to help you get there, it needs to be used correctly!


Markets
U.S. Debt Interest Payments Reach $1 Trillion
U.S. debt interest payments have surged past the $1 trillion dollar mark, amid high interest rates and an ever-expanding debt burden.


U.S. Debt Interest Payments Reach $1 Trillion
This was originally posted on our Voronoi app. Download the app for free on iOS or Android and discover incredible data-driven charts from a variety of trusted sources.
The cost of paying for America’s national debt crossed the $1 trillion dollar mark in 2023, driven by high interest rates and a record $34 trillion mountain of debt.
Over the last decade, U.S. debt interest payments have more than doubled amid vast government spending during the pandemic crisis. As debt payments continue to soar, the Congressional Budget Office (CBO) reported that debt servicing costs surpassed defense spending for the first time ever this year.
This graphic shows the sharp rise in U.S. debt payments, based on data from the Federal Reserve.
A $1 Trillion Interest Bill, and Growing
Below, we show how U.S. debt interest payments have risen at a faster pace than at another time in modern history:
| Date | Interest Payments | U.S. National Debt |
|---|---|---|
| 2023 | $1.0T | $34.0T |
| 2022 | $830B | $31.4T |
| 2021 | $612B | $29.6T |
| 2020 | $518B | $27.7T |
| 2019 | $564B | $23.2T |
| 2018 | $571B | $22.0T |
| 2017 | $493B | $20.5T |
| 2016 | $460B | $20.0T |
| 2015 | $435B | $18.9T |
| 2014 | $442B | $18.1T |
| 2013 | $425B | $17.2T |
| 2012 | $417B | $16.4T |
| 2011 | $433B | $15.2T |
| 2010 | $400B | $14.0T |
| 2009 | $354B | $12.3T |
| 2008 | $380B | $10.7T |
| 2007 | $414B | $9.2T |
| 2006 | $387B | $8.7T |
| 2005 | $355B | $8.2T |
| 2004 | $318B | $7.6T |
| 2003 | $294B | $7.0T |
| 2002 | $298B | $6.4T |
| 2001 | $318B | $5.9T |
| 2000 | $353B | $5.7T |
| 1999 | $353B | $5.8T |
| 1998 | $360B | $5.6T |
| 1997 | $368B | $5.5T |
| 1996 | $362B | $5.3T |
| 1995 | $357B | $5.0T |
| 1994 | $334B | $4.8T |
| 1993 | $311B | $4.5T |
| 1992 | $306B | $4.2T |
| 1991 | $308B | $3.8T |
| 1990 | $298B | $3.4T |
| 1989 | $275B | $3.0T |
| 1988 | $254B | $2.7T |
| 1987 | $240B | $2.4T |
| 1986 | $225B | $2.2T |
| 1985 | $219B | $1.9T |
| 1984 | $205B | $1.7T |
| 1983 | $176B | $1.4T |
| 1982 | $157B | $1.2T |
| 1981 | $142B | $1.0T |
| 1980 | $113B | $930.2B |
| 1979 | $96B | $845.1B |
| 1978 | $84B | $789.2B |
| 1977 | $69B | $718.9B |
| 1976 | $61B | $653.5B |
| 1975 | $55B | $576.6B |
| 1974 | $50B | $492.7B |
| 1973 | $45B | $469.1B |
| 1972 | $39B | $448.5B |
| 1971 | $36B | $424.1B |
| 1970 | $35B | $389.2B |
| 1969 | $30B | $368.2B |
| 1968 | $25B | $358.0B |
| 1967 | $23B | $344.7B |
| 1966 | $21B | $329.3B |
Interest payments represent seasonally adjusted annual rate at the end of Q4.
At current rates, the U.S. national debt is growing by a remarkable $1 trillion about every 100 days, equal to roughly $3.6 trillion per year.
As the national debt has ballooned, debt payments even exceeded Medicaid outlays in 2023—one of the government’s largest expenditures. On average, the U.S. spent more than $2 billion per day on interest costs last year. Going further, the U.S. government is projected to spend a historic $12.4 trillion on interest payments over the next decade, averaging about $37,100 per American.
Exacerbating matters is that the U.S. is running a steep deficit, which stood at $1.1 trillion for the first six months of fiscal 2024. This has accelerated due to the 43% increase in debt servicing costs along with a $31 billion dollar increase in defense spending from a year earlier. Additionally, a $30 billion increase in funding for the Federal Deposit Insurance Corporation in light of the regional banking crisis last year was a major contributor to the deficit increase.
Overall, the CBO forecasts that roughly 75% of the federal deficit’s increase will be due to interest costs by 2034.

-

 Markets2 weeks ago
Visualizing America’s Shortage of Affordable Homes
-

 Technology1 week ago
Ranked: Semiconductor Companies by Industry Revenue Share
-

 Money1 week ago
Which States Have the Highest Minimum Wage in America?
-

 Real Estate1 week ago
Ranked: The Most Valuable Housing Markets in America
-

 Business2 weeks ago
Charted: Big Four Market Share by S&P 500 Audits
-

 AI2 weeks ago
The Stock Performance of U.S. Chipmakers So Far in 2024
-

 Misc2 weeks ago
Almost Every EV Stock is Down After Q1 2024
-

 Money2 weeks ago
Where Does One U.S. Tax Dollar Go?