Markets
The 20 Companies With the Most Profit Per Employee
The 20 Companies With the Most Profit Per Employee
Profit per worker on the Fortune Global 500
The Chart of the Week is a weekly Visual Capitalist feature on Fridays.
Earlier in the week, we showed you the companies that make the most profit per second.
It’s a measure where Apple blows every other company out of the water. The tech giant makes $1,444 in net income per second – about $700 higher than its closest competition, which include banks, conglomerates, and other tech companies.
While Apple may dominate when seconds are used as the denominator, how does it do when looking at profit per employee instead?
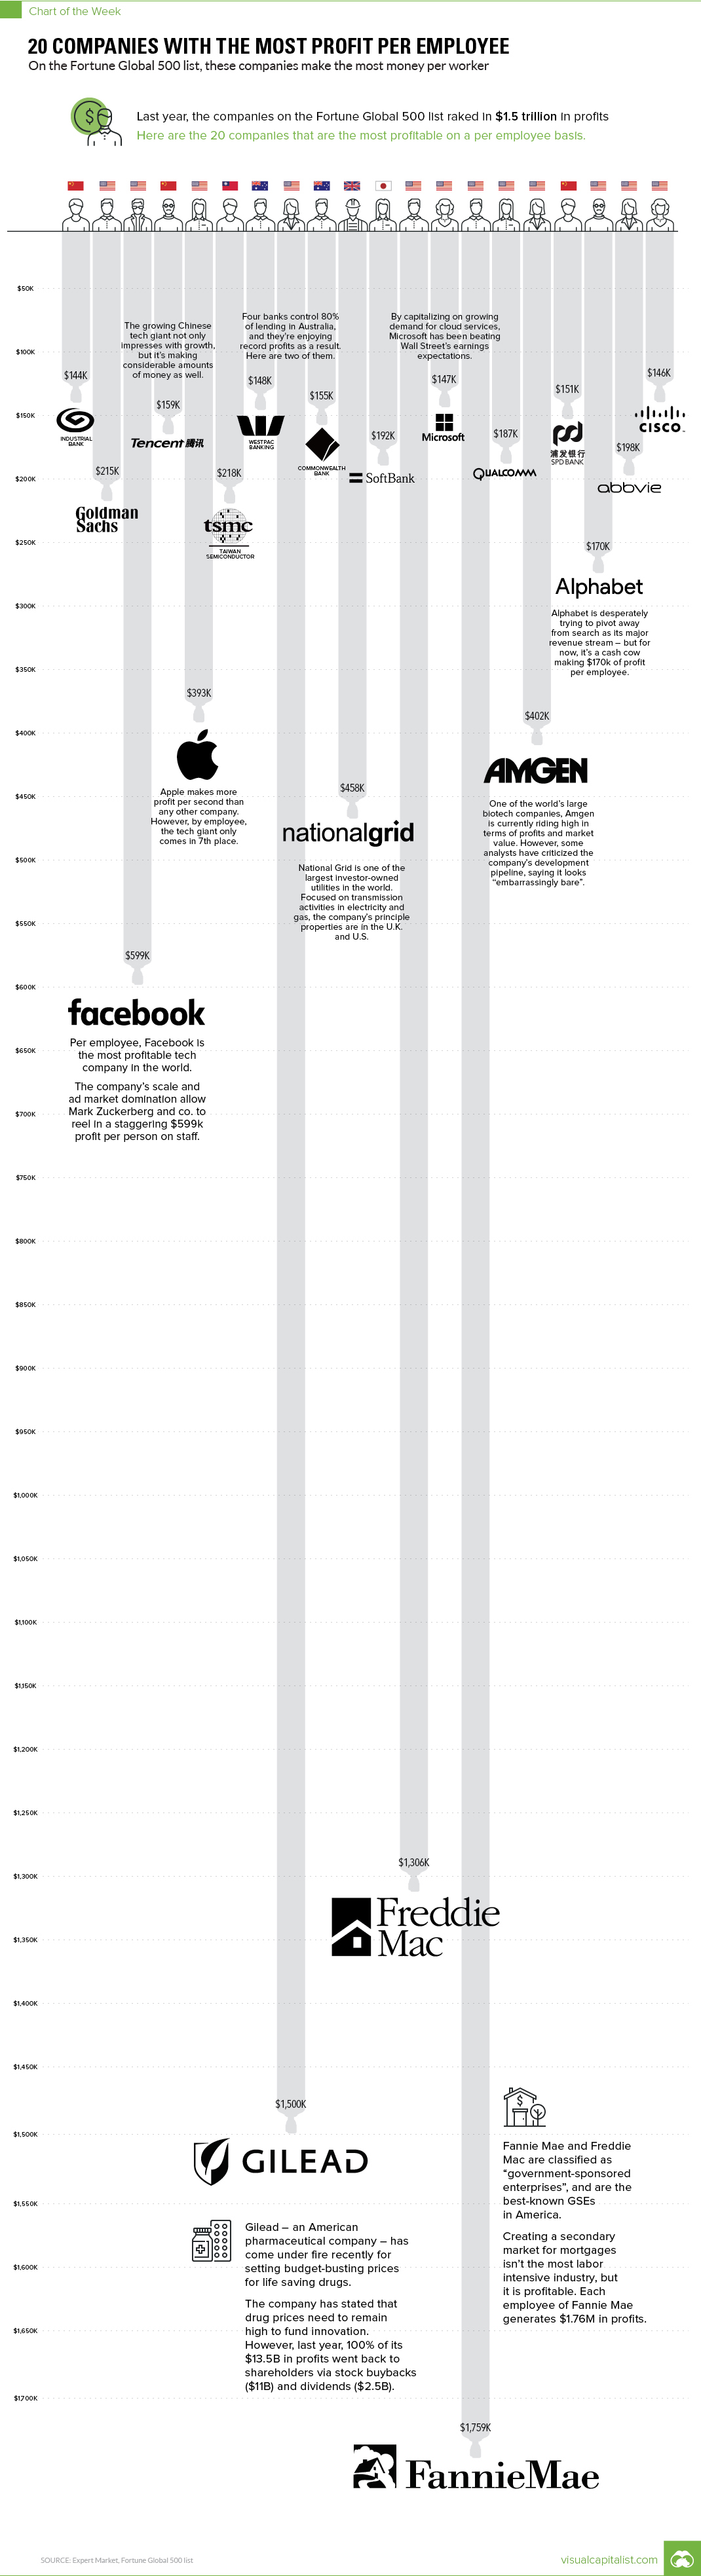
Profit Per Employee
Expert Market crunched the numbers on the 100 most profitable companies on the Fortune Global 500 list.
By comparing profits to employees, they came up with a list of the 20 most profitable companies on a per person basis.
| Ranking | Company | Country | Profit per Employee |
|---|---|---|---|
| 1 | Fannie Mae | US | $1,759,000 |
| 2 | Gilead Sciences | US | $1,500,111 |
| 3 | Freddie Mac | US | $1,306,419 |
| 4 | US | $599,307 | |
| 5 | National Grid | UK | $458,639 |
| 6 | Amgen | US | $402,187 |
| 7 | Apple | US | $393,853 |
| 8 | Alphabet | US | $270,329 |
| 9 | Taiwan Semiconductor | Taiwan | $218,951 |
| 10 | Goldman Sachs | US | $215,058 |
| 11 | AbbVie | US | $198,433 |
| 12 | SoftBank Group | Japan | $192,442 |
| 13 | Qualcomm | US | $187,049 |
| 14 | Tencent Holdings | China | $159,533 |
| 15 | Westpac Banking | Australia | $155,244 |
| 16 | SPD Bank | China | $151,287 |
| 17 | Commonwealth Bank | Australia | $148,749 |
| 18 | Microsoft | US | $147,351 |
| 19 | Cisco Systems | US | $145,712 |
| 20 | Industrial Bank | China | $144,141 |
While Apple makes a solid $393,853 in profit for each employee, the company only ranks #7 on the list.
It gets outperformed by one tech company (Facebook, at $599,307 per employee), as well as a combination of companies from the financial, utilities, and biotech sectors.
State Sponsored Profits
On the list, perhaps the most surprising entries are Fannie Mae and Freddie Mac. These two U.S. government-sponsored enterprises, which both buy and repackage bank mortgages for the secondary market, were a part of the largest federal bailout in history ($187 billion) during the financial crisis in 2008.
At the time, they were highly criticized for creating an environment of “moral hazard”. As Investopedia puts it:
Quasi-government agencies such as Fannie Mae and Freddie Mac offered implicit support to lenders underwriting real estate loans.
-Investopedia
Despite this one-time catastrophe, the two organizations are very profitable today – so profitable, in fact, that they rank #1 and #3 on the above list.
Last year, Fannie Mae and Freddie Mac brought in $12.3 billion and $7.8 billion in profit respectively. And on a per capita basis, that equates to $1.76 million and $1.5 million per employee.


Markets
U.S. Debt Interest Payments Reach $1 Trillion
U.S. debt interest payments have surged past the $1 trillion dollar mark, amid high interest rates and an ever-expanding debt burden.


U.S. Debt Interest Payments Reach $1 Trillion
This was originally posted on our Voronoi app. Download the app for free on iOS or Android and discover incredible data-driven charts from a variety of trusted sources.
The cost of paying for America’s national debt crossed the $1 trillion dollar mark in 2023, driven by high interest rates and a record $34 trillion mountain of debt.
Over the last decade, U.S. debt interest payments have more than doubled amid vast government spending during the pandemic crisis. As debt payments continue to soar, the Congressional Budget Office (CBO) reported that debt servicing costs surpassed defense spending for the first time ever this year.
This graphic shows the sharp rise in U.S. debt payments, based on data from the Federal Reserve.
A $1 Trillion Interest Bill, and Growing
Below, we show how U.S. debt interest payments have risen at a faster pace than at another time in modern history:
| Date | Interest Payments | U.S. National Debt |
|---|---|---|
| 2023 | $1.0T | $34.0T |
| 2022 | $830B | $31.4T |
| 2021 | $612B | $29.6T |
| 2020 | $518B | $27.7T |
| 2019 | $564B | $23.2T |
| 2018 | $571B | $22.0T |
| 2017 | $493B | $20.5T |
| 2016 | $460B | $20.0T |
| 2015 | $435B | $18.9T |
| 2014 | $442B | $18.1T |
| 2013 | $425B | $17.2T |
| 2012 | $417B | $16.4T |
| 2011 | $433B | $15.2T |
| 2010 | $400B | $14.0T |
| 2009 | $354B | $12.3T |
| 2008 | $380B | $10.7T |
| 2007 | $414B | $9.2T |
| 2006 | $387B | $8.7T |
| 2005 | $355B | $8.2T |
| 2004 | $318B | $7.6T |
| 2003 | $294B | $7.0T |
| 2002 | $298B | $6.4T |
| 2001 | $318B | $5.9T |
| 2000 | $353B | $5.7T |
| 1999 | $353B | $5.8T |
| 1998 | $360B | $5.6T |
| 1997 | $368B | $5.5T |
| 1996 | $362B | $5.3T |
| 1995 | $357B | $5.0T |
| 1994 | $334B | $4.8T |
| 1993 | $311B | $4.5T |
| 1992 | $306B | $4.2T |
| 1991 | $308B | $3.8T |
| 1990 | $298B | $3.4T |
| 1989 | $275B | $3.0T |
| 1988 | $254B | $2.7T |
| 1987 | $240B | $2.4T |
| 1986 | $225B | $2.2T |
| 1985 | $219B | $1.9T |
| 1984 | $205B | $1.7T |
| 1983 | $176B | $1.4T |
| 1982 | $157B | $1.2T |
| 1981 | $142B | $1.0T |
| 1980 | $113B | $930.2B |
| 1979 | $96B | $845.1B |
| 1978 | $84B | $789.2B |
| 1977 | $69B | $718.9B |
| 1976 | $61B | $653.5B |
| 1975 | $55B | $576.6B |
| 1974 | $50B | $492.7B |
| 1973 | $45B | $469.1B |
| 1972 | $39B | $448.5B |
| 1971 | $36B | $424.1B |
| 1970 | $35B | $389.2B |
| 1969 | $30B | $368.2B |
| 1968 | $25B | $358.0B |
| 1967 | $23B | $344.7B |
| 1966 | $21B | $329.3B |
Interest payments represent seasonally adjusted annual rate at the end of Q4.
At current rates, the U.S. national debt is growing by a remarkable $1 trillion about every 100 days, equal to roughly $3.6 trillion per year.
As the national debt has ballooned, debt payments even exceeded Medicaid outlays in 2023—one of the government’s largest expenditures. On average, the U.S. spent more than $2 billion per day on interest costs last year. Going further, the U.S. government is projected to spend a historic $12.4 trillion on interest payments over the next decade, averaging about $37,100 per American.
Exacerbating matters is that the U.S. is running a steep deficit, which stood at $1.1 trillion for the first six months of fiscal 2024. This has accelerated due to the 43% increase in debt servicing costs along with a $31 billion dollar increase in defense spending from a year earlier. Additionally, a $30 billion increase in funding for the Federal Deposit Insurance Corporation in light of the regional banking crisis last year was a major contributor to the deficit increase.
Overall, the CBO forecasts that roughly 75% of the federal deficit’s increase will be due to interest costs by 2034.

-

 Maps1 week ago
The Largest Earthquakes in the New York Area (1970-2024)
-

 Money2 weeks ago
Where Does One U.S. Tax Dollar Go?
-

 Automotive2 weeks ago
Almost Every EV Stock is Down After Q1 2024
-

 AI2 weeks ago
The Stock Performance of U.S. Chipmakers So Far in 2024
-

 Markets2 weeks ago
Charted: Big Four Market Share by S&P 500 Audits
-

 Real Estate2 weeks ago
Ranked: The Most Valuable Housing Markets in America
-

 Money2 weeks ago
Which States Have the Highest Minimum Wage in America?
-

 AI2 weeks ago
Ranked: Semiconductor Companies by Industry Revenue Share