Mining
12 Stunning Visualizations of Gold Shows Its Rarity
For the companies exploring for gold, a deposit that has more than one gram of gold for every tonne of earth is an exciting prospect. In fact, in our 2013 report summarizing the world’s gold deposits, we found that the average grade of gold deposits in the world is around that amount: about 1.01 g/t.
Think about that for a moment. One gram (0.035 oz) is equal to the mass of a small paper clip. This small amount of gold is usually not even in one place – it is dispersed through a tonne of rock and dirt in smaller amounts, most of the time invisible to the naked eye. For some companies that have the stars align with easy metallurgy, a deposit near surface, and open pit potential, this gram per tonne deposit may even somehow be economic.
It’s hard to believe that such a small amount of gold could be worth so much, and that is why great visualizations can help us understand the rarity of this yellow metal. Luckily, the folks at Demonocracy.info have done the heavy lifting for us, putting together a series of 3D visualizations of gold bullion bars showcasing the world’s gold that has been mined thus far. Note: these visualizations are a couple of years old and optimistically have the value of gold pegged at US$2,000 per oz, presumably for the ease of calculations.
For those interested, we have also put together a similar slideshow on the topic, showing how much gold, silver, copper, and other metals are mined each year.
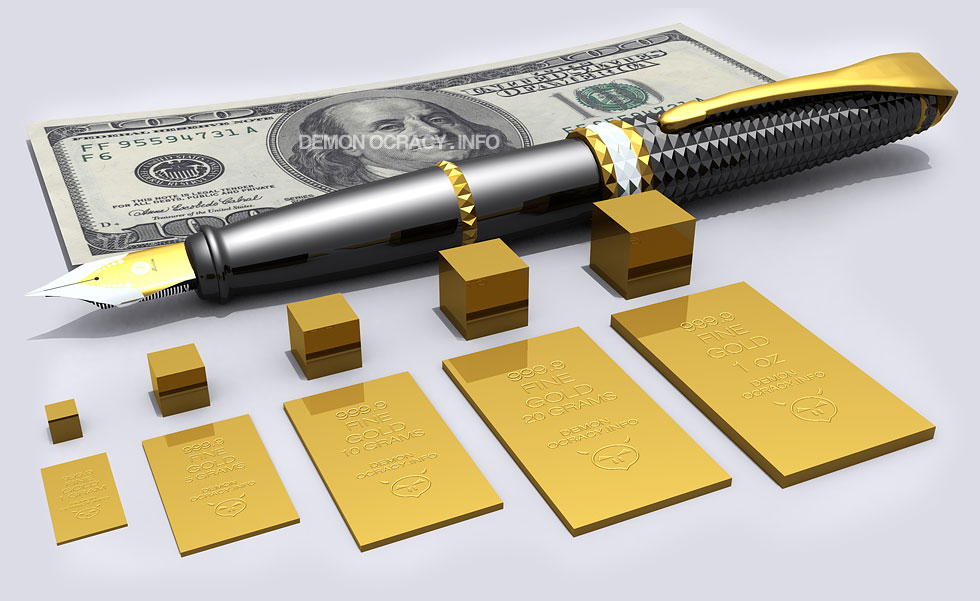
Smaller denominations of gold plates: 1 gram, 5 grams, 10 grams, 20 grams, and 1 troy oz of gold.
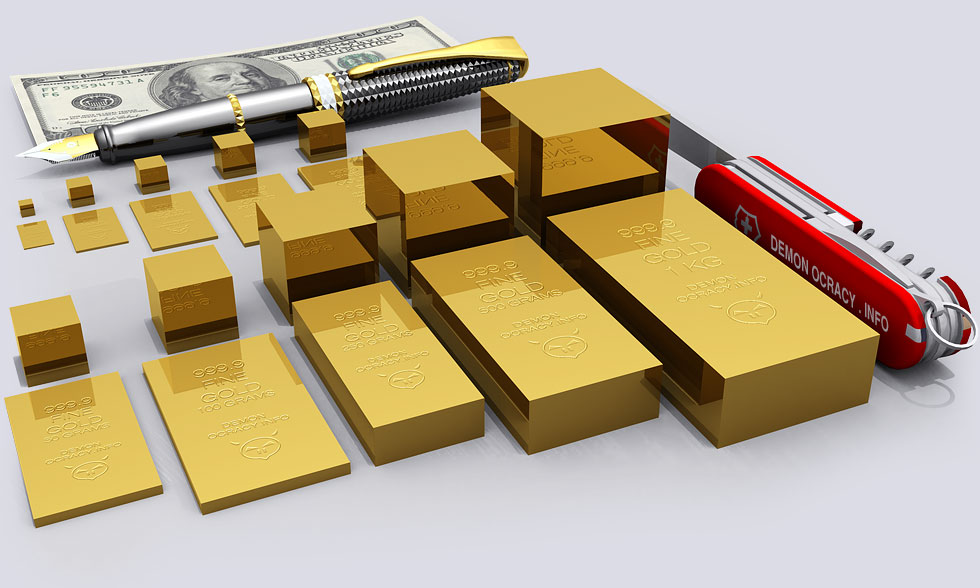
Larger denominations of gold plates: 50 grams, 100 grams, 250 grams, 500 grams, and 1 kg of gold.
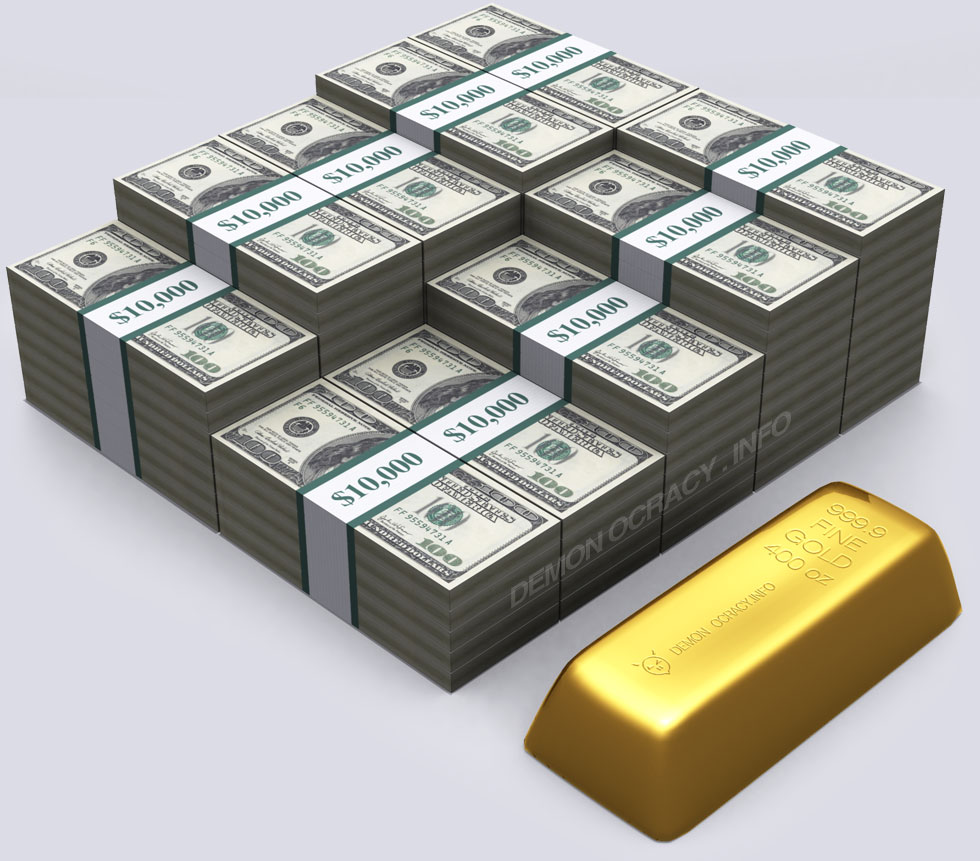
This 400 oz gold bar, at $2,000 per oz gold, is worth the $800,000 cash beside it. The gold bar is extremely heavy, weighing more than three full milk jugs.
Here’s what one tonne of gold looks like. At $2,000 per oz, it’s worth $64.3 million.
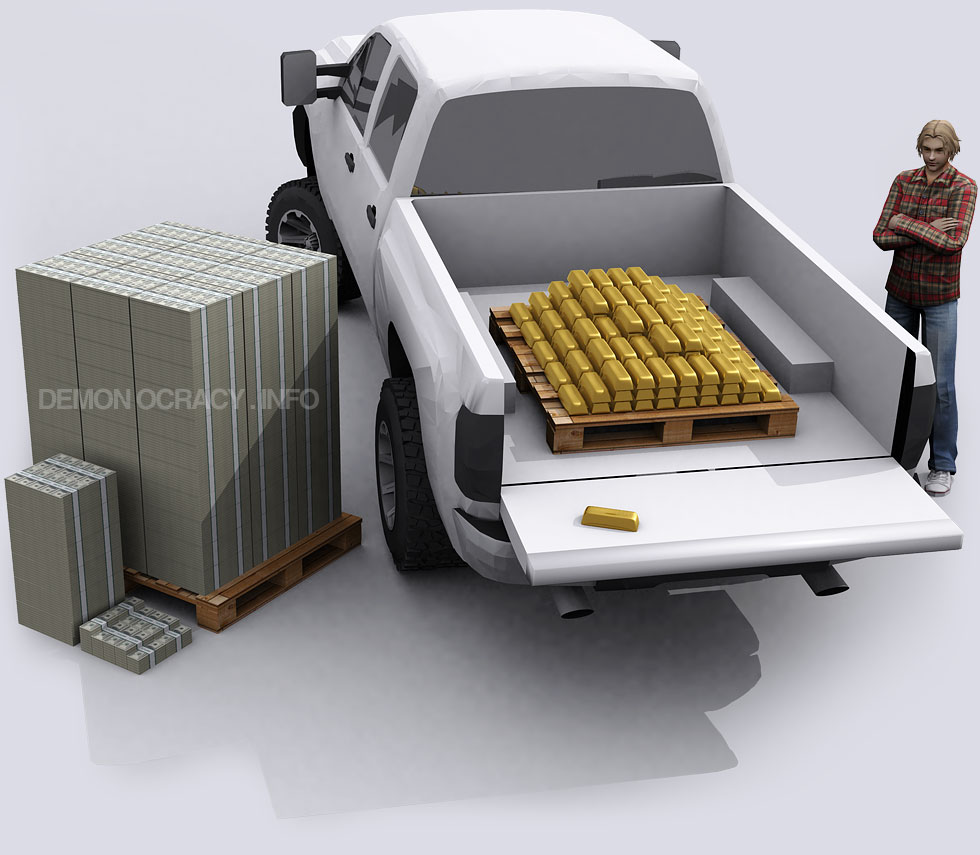
Gold is so heavy that the suspension of an average truck would break if it held anymore than pictured above. Even if the truck’s suspension broke, the load of gold in the back could buy 2,660 brand new trucks at an MSRP of $40,000 per truck.

Here’s 10 tonnes of gold compared to 100 tonnes of the yellow metal.
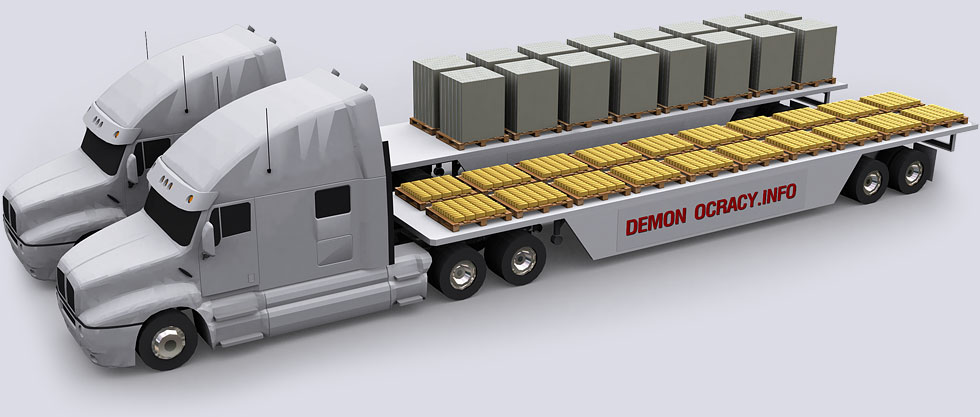
This semi-truck is carrying the maximum load it can legally carry, which is about about 25 tonnes. Here there are 24.88 tonnes of gold, worth $1.6 billion.
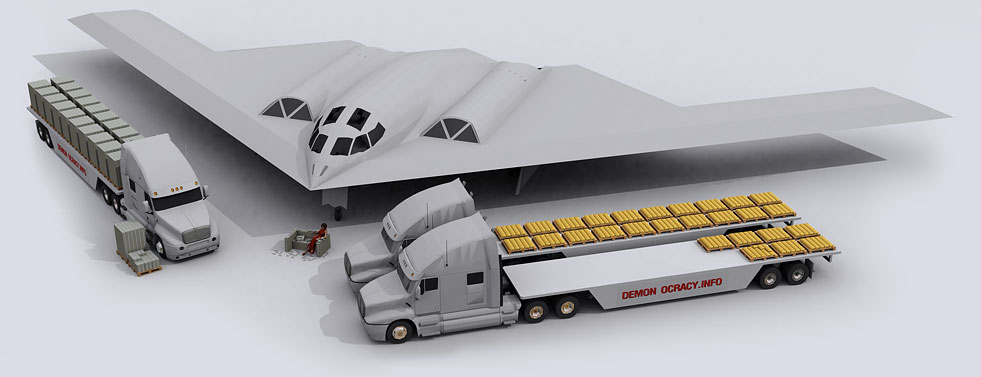
The Northrop Grumman B2 Spirit Bomber program cost $44.75 Billion for a total of 21 units built, which averages to $2,130,952,380 per unit. Shown here is the amount of gold it costs to buy one unit.
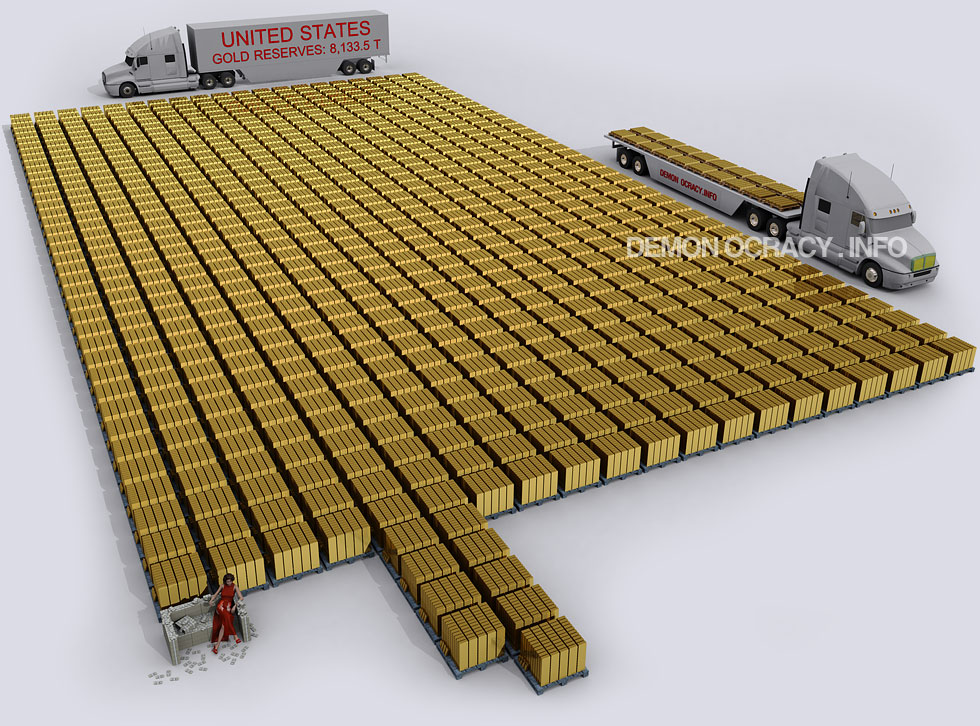
Here’s the entire gold reserves of the United States government, which is 8,133.5 tonnes.
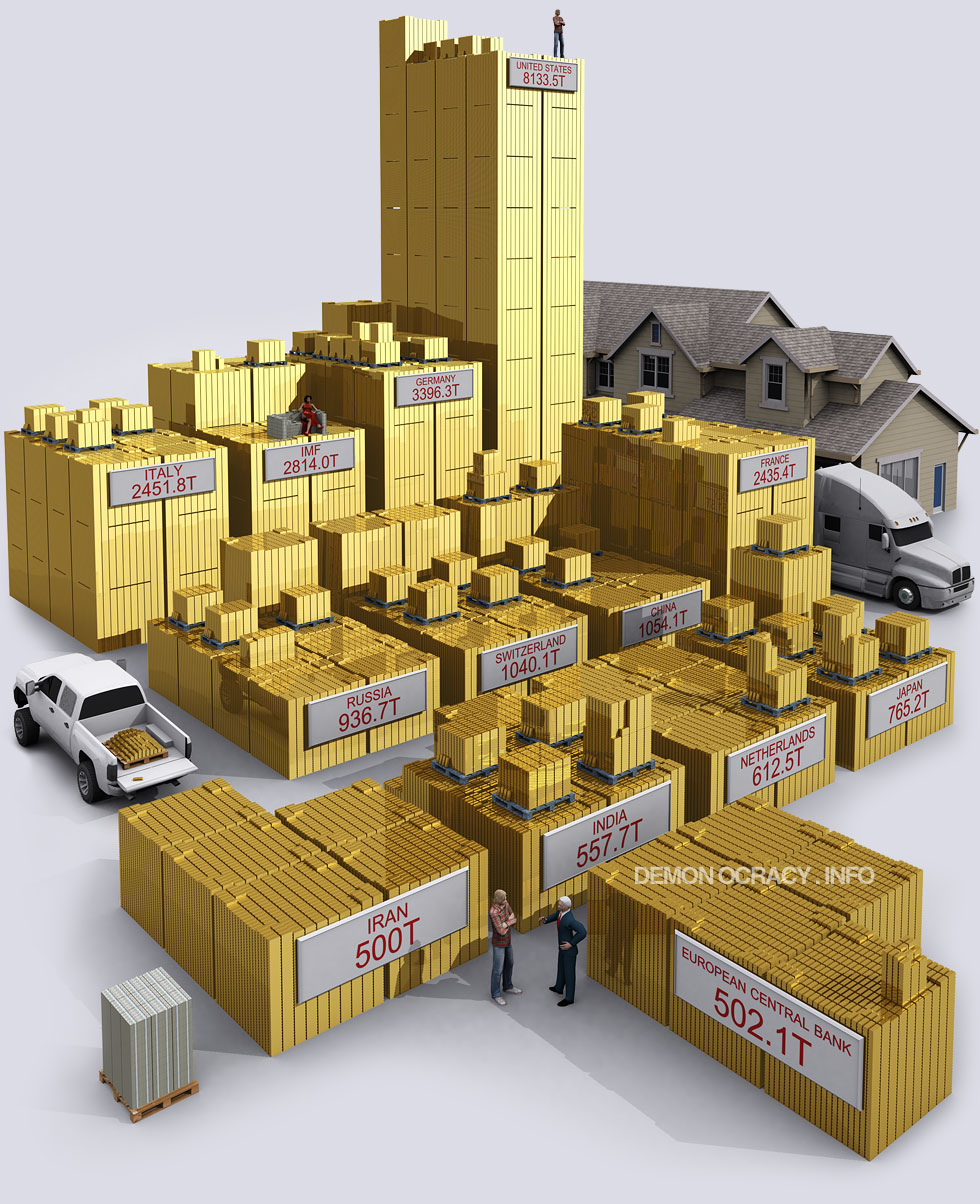
Here’s the world’s gold reserves by government circa 2012. This is slightly outdated, with China and Russia both having significant increases since then.

All gold mined in history, stacked in 400 oz bars. The 166,500 tonnes here is actually divided into four levels: the bottom level is jewelry (50.5% of all gold), the 2nd level is private investment (18.7%), the third level is world governments (17.4%), and the highest level is other uses for gold such as industry (13.4%).
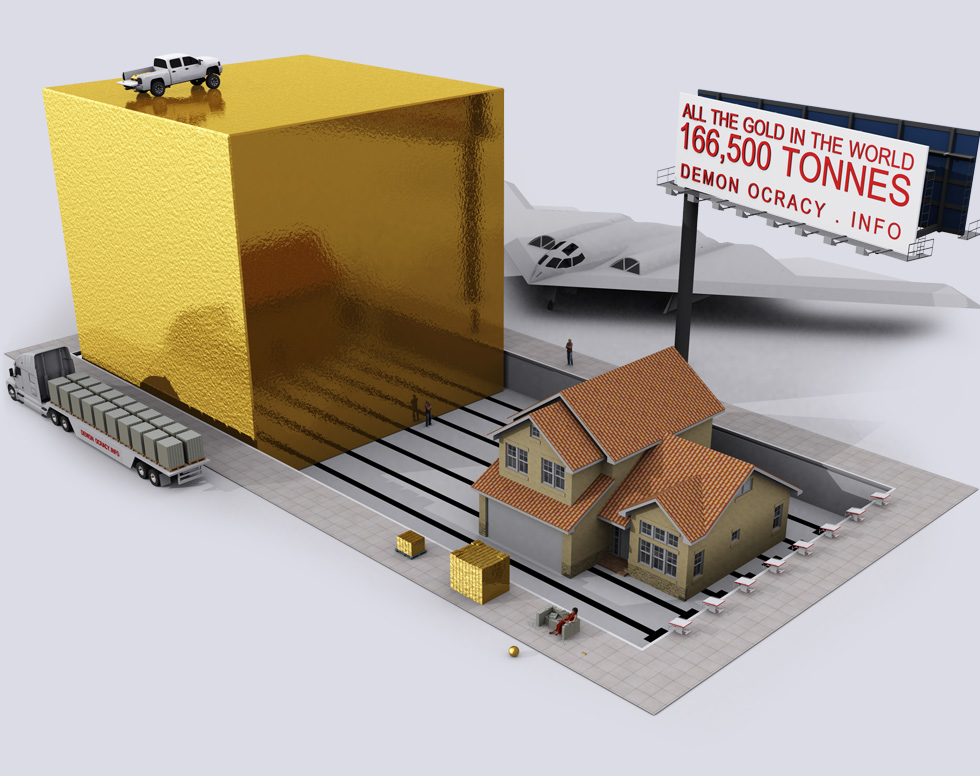
Lastly, we finish off with an image of all of the world’s mined gold in one cube with dimensions of 20.5m. If it was all melted, it would fit within the confines of an Olympic Swimming Pool.
Want to learn everything you need to know about gold in about 20 minutes? Our five-part Gold Series covers everything from its rich history, supply and geology, demand drivers, investment properties, and market trends.


Copper
Brass Rods: The Secure Choice
This graphic shows why brass rods are the secure choice for precision-machined and forged parts.


Brass Rods: The Secure Choice
The unique combination of machinability and recyclability makes brass rods the secure choice for manufacturers seeking future-proof raw material solutions.
This infographic, from the Copper Development Association, shows three ways brass rods give manufacturers greater control and a license to grow in the competitive market for precision-machined and forged products.
Future-Proof Investments in New Machine Tools
A material’s machinability directly impacts machine throughput, which typically has the largest impact on machine shop profitability.
The high-speed machining capabilities of brass rods maximize machine tool performance, allowing manufacturers to run the material faster and longer without sacrificing tool life, chip formation, or surface quality.
The high machining efficiency of brass leads to reduced per-part costs, quicker return on investment (ROI) for new machine tools, and expanded production capacity for new projects.
Supply Security Through Closed Loop Recycling
Brass, like its parent element copper, can be infinitely recycled.
In 2022, brass- and wire-rod mills accounted for the majority of the 830,000 tonnes of copper recycled from scrap in the United States.
Given that scrap ratios for machined parts typically range from 60-70% by weight, producing mills benefit from a secure and steady supply of clean scrap returned directly from customers, which is recycled to create new brass rods.
The high residual value of brass scrap creates a strong recycling incentive. Scrap buy back programs give manufacturers greater control over raw material net costs as scrap value is often factored into supplier purchase agreements.
Next Generation Alloys for a Lead-Free Future
Increasingly stringent global regulations continue to pressure manufacturers to minimize the use of materials containing trace amounts of lead and other harmful impurities.
The latest generation of brass-rod alloys is engineered to meet the most demanding criteria for lead leaching in drinking water and other sensitive applications.
Seven brass-rod alloys passed rigorous testing to become the only ‘Acceptable Materials’ against lower lead leaching criteria recently adopted in the national U.S. drinking water quality standard, NSF 61.
Learn more about the advantages of brass rods solutions.

-

 Base Metals1 year ago
Ranked: The World’s Largest Copper Producers
Many new technologies critical to the energy transition rely on copper. Here are the world’s largest copper producers.
-

 Silver2 years ago
Mapped: Solar Power by Country in 2021
In 2020, solar power saw its largest-ever annual capacity expansion at 127 gigawatts. Here’s a snapshot of solar power capacity by country.
-

 Batteries5 years ago
Visualizing Copper’s Role in the Transition to Clean Energy
A clean energy transition is underway as wind, solar, and batteries take center stage. Here’s how copper plays the critical role in these technologies.
-

 Science5 years ago
Everything You Need to Know on VMS Deposits
Deep below the ocean’s waves, VMS deposits spew out massive amounts of minerals like copper, zinc, and gold, making them a key source of the metals…
-
 Copper5 years ago
How Much Copper is in an Electric Vehicle?
Have you ever wondered how much copper is in an electric vehicle? This infographic shows the metal’s properties as well as the quantity of copper used.
-
 Copper6 years ago
Copper: Driving the Green Energy Revolution
Renewable energy is set to fuel a new era of copper demand – here’s how much copper is used in green applications from EVs to photovoltaics.


-

 Real Estate2 weeks ago
Visualizing America’s Shortage of Affordable Homes
-

 Technology1 week ago
Ranked: Semiconductor Companies by Industry Revenue Share
-

 Money1 week ago
Which States Have the Highest Minimum Wage in America?
-

 Real Estate1 week ago
Ranked: The Most Valuable Housing Markets in America
-

 Business2 weeks ago
Charted: Big Four Market Share by S&P 500 Audits
-

 AI2 weeks ago
The Stock Performance of U.S. Chipmakers So Far in 2024
-

 Misc2 weeks ago
Almost Every EV Stock is Down After Q1 2024
-

 Money2 weeks ago
Where Does One U.S. Tax Dollar Go?